
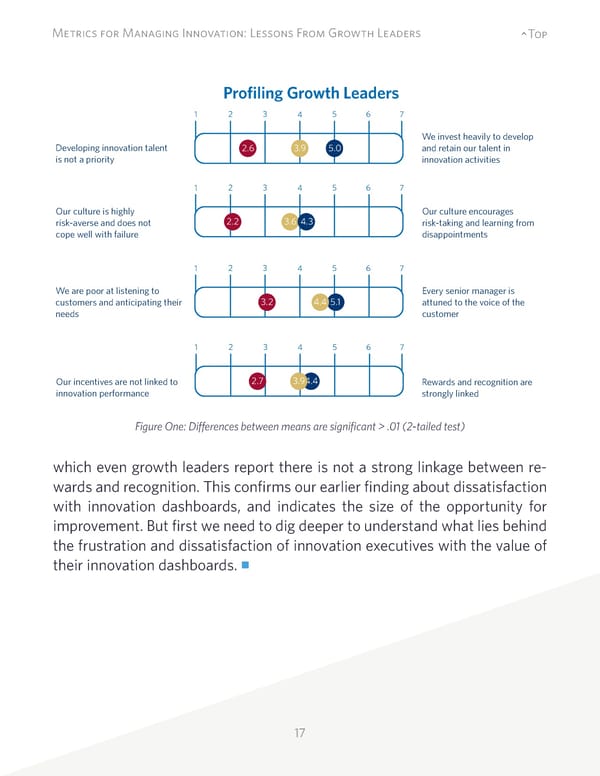
17 Metrics for Managing Innovation: Lessons From Growth Leaders ^Top which even growth leaders report there is not a strong linkage between re- wards and recognition. This confirms our earlier finding about dissatisfaction with innovation dashboards, and indicates the size of the opportunity for improvement. But first we need to dig deeper to understand what lies behind the frustration and dissatisfaction of innovation executives with the value of their innovation dashboards. Profiling Growth Leaders Developing innovation talent is not a priority Our culture is highly risk-averse and does not cope well with failure We are poor at listening to customers and anticipating their needs Our incentives are not linked to innovation performance We invest heavily to develop and retain our talent in innovation activities Our culture encourages risk-taking and learning from disappointments Every senior manager is attuned to the voice of the customer Rewards and recognition are strongly linked 2.6 1 2 3 4 5 6 7 3.9 5.0 2.2 1 2 3 4 5 6 7 3.6 4.3 3.2 1 2 3 4 5 6 7 4.4 5.1 2.7 1 2 3 4 5 6 7 4.4 = Growth laggards = Average performers = Growth leaders 3.9 Figure One: Differences between means are significant > .01 (2-tailed test)
 Metrics for Managing Innovation: Lessons From Growth Leaders Page 16 Page 18