
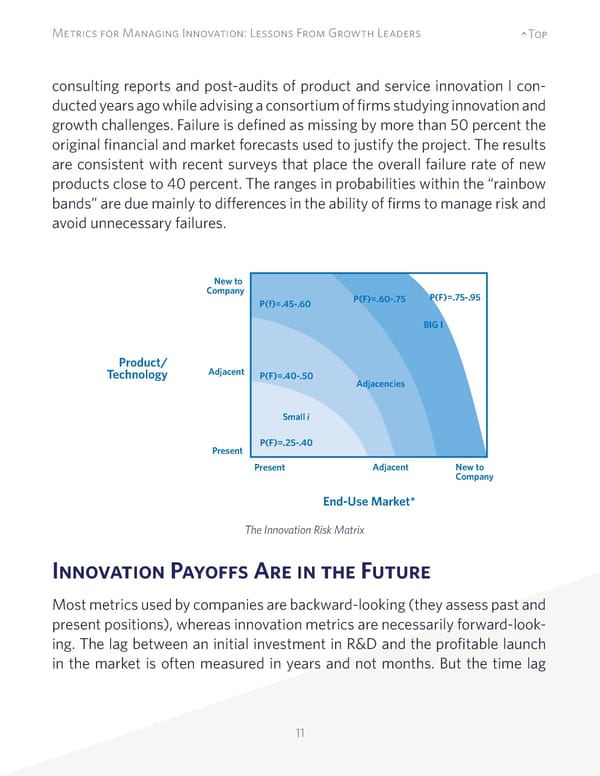
11 Metrics for Managing Innovation: Lessons From Growth Leaders ^Top consulting reports and post-audits of product and service innovation I con- ducted years ago while advising a consortium of firms studying innovation and growth challenges. Failure is defined as missing by more than 50 percent the original financial and market forecasts used to justify the project. The results are consistent with recent surveys that place the overall failure rate of new products close to 40 percent. The ranges in probabilities within the “rainbow bands” are due mainly to differences in the ability of firms to manage risk and avoid unnecessary failures. Innovation Payoffs Are in the Future Most metrics used by companies are backward-looking (they assess past and present positions), whereas innovation metrics are necessarily forward-look- ing. The lag between an initial investment in R&D and the profitable launch in the market is often measured in years and not months. But the time lag New to Company Adjacent Product/ Technology Present Present Adjacent New to Company End-Use Market* P(f)=.45-.60 P(F)=.40-.50 Small i P(F)=.25-.40 P(F)=.60-.75 P(F)=.75-.95 BIG I Adjacencies The Innovation Risk Matrix
 Metrics for Managing Innovation: Lessons From Growth Leaders Page 10 Page 12