
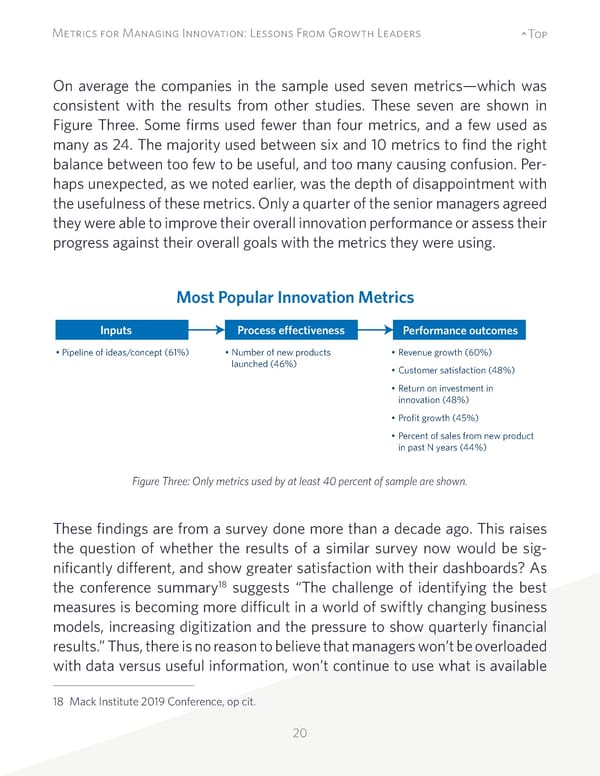
20 Metrics for Managing Innovation: Lessons From Growth Leaders ^Top On average the companies in the sample used seven metrics—which was consistent with the results from other studies. These seven are shown in Figure Three. Some firms used fewer than four metrics, and a few used as many as 24. The majority used between six and 10 metrics to find the right balance between too few to be useful, and too many causing confusion. Per- haps unexpected, as we noted earlier, was the depth of disappointment with the usefulness of these metrics. Only a quarter of the senior managers agreed they were able to improve their overall innovation performance or assess their progress against their overall goals with the metrics they were using. These findings are from a survey done more than a decade ago. This raises the question of whether the results of a similar survey now would be sig- nificantly different, and show greater satisfaction with their dashboards? As the conference summary18 suggests “The challenge of identifying the best measures is becoming more difficult in a world of swiftly changing business models, increasing digitization and the pressure to show quarterly financial results.” Thus, there is no reason to believe that managers won’t be overloaded with data versus useful information, won’t continue to use what is available 18 Mack Institute 2019 Conference, op cit. Most Popular Innovation Metrics Inputs Process efectiveness Performance outcomes • Pipeline of ideas/concept (61%) • Number of new products launched (46%) • Revenue growth (60%) • Customer satisfaction (48%) • Return on investment in innovation (48%) • Profit growth (45%) • Percent of sales from new product in past N years (44%) Figure Three: Only metrics used by at least 40 percent of sample are shown.
 Metrics for Managing Innovation: Lessons From Growth Leaders Page 19 Page 21