
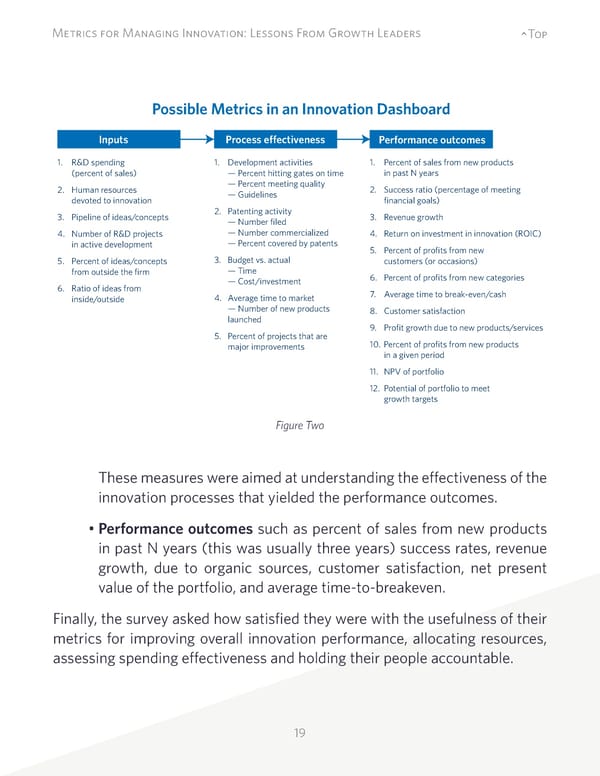
19 Metrics for Managing Innovation: Lessons From Growth Leaders ^Top These measures were aimed at understanding the effectiveness of the innovation processes that yielded the performance outcomes. • Performance outcomes such as percent of sales from new products in past N years (this was usually three years) success rates, revenue growth, due to organic sources, customer satisfaction, net present value of the portfolio, and average time-to-breakeven. Finally, the survey asked how satisfied they were with the usefulness of their metrics for improving overall innovation performance, allocating resources, assessing spending effectiveness and holding their people accountable. Possible Metrics in an Innovation Dashboard Inputs Process efectiveness Performance outcomes 1. R&D spending (percent of sales) 2. Human resources devoted to innovation 3. Pipeline of ideas/concepts 4. Number of R&D projects in active development 5. Percent of ideas/concepts from outside the firm 6. Ratio of ideas from inside/outside 1. Development activities — Percent hitting gates on time — Percent meeting quality — Guidelines 2. Patenting activity — Number filed — Number commercialized — Percent covered by patents 3. Budget vs. actual — Time — Cost/investment 4. Average time to market — Number of new products launched 5. Percent of projects that are major improvements 1. Percent of sales from new products in past N years 2. Success ratio (percentage of meeting financial goals) 3. Revenue growth 4. Return on investment in innovation (ROIC) 5. Percent of profits from new customers (or occasions) 6. Percent of profits from new categories 7. Average time to break-even/cash 8. Customer satisfaction 9. Profit growth due to new products/services 10. Percent of profits from new products in a given period 11. NPV of portfolio 12. Potential of portfolio to meet growth targets Figure Two
 Metrics for Managing Innovation: Lessons From Growth Leaders Page 18 Page 20